Only 8 Days Left For Registration!

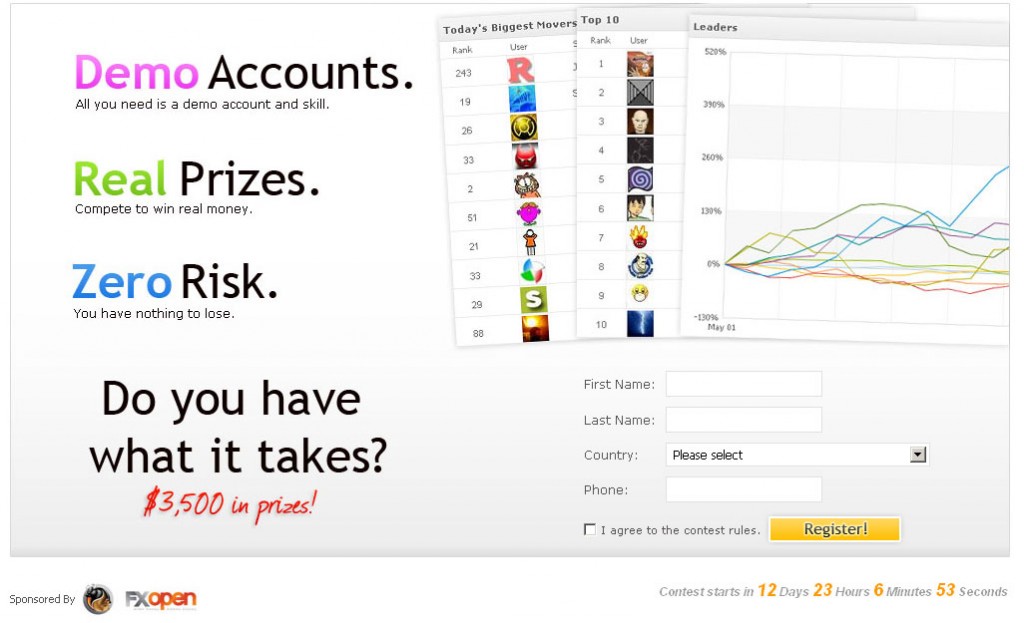
If you haven’t registered yet for our latest contest, hurry up and register before the registration ends.

To register, please go here: https://www.myfxbook.com/contests/trading-championship-february-2011/3/rules

There are already 689 traders, and still counting 🙂

Trading is performed on demo accounts, yet the prizes are very real – $3,500 in total!

P.S. We’ve been asked many times so just a quick reminder – trading accounts are disabled until the start of the contest, so this is nothing to worry about.

Good luck!

The Myfxbook team.

New Charts – Duration

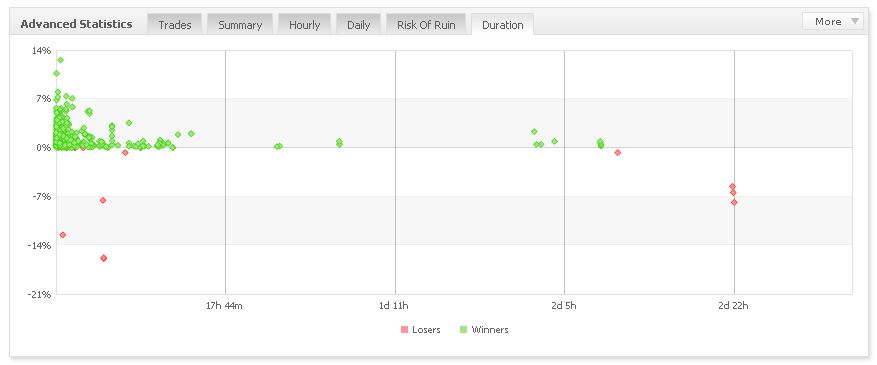
Today we’ve added new charts to your tool box – Duration:

The new charts can be found in the advanced statistics window, under the ‘Duration’ tab.

The charts include 4 duration analysis options:

  • Growth
  • Profit
  • Pips
  • Lots

Looking at the new charts will help you quickly evaluate and characterize the trading system (long terms, intraday, or scalping) and its consistency.

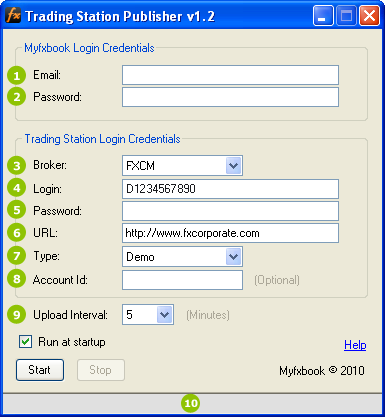
Oanda users – please keep in mind the current method of connecting to Oanda accounts will stop working on January 31st (tomorrow) as discussed here: https://blog.myfxbook.com/2011/01/03/oanda-accounts-will-not-be-supported/ To keep using Myfxbook with Oanda accounts, you’ll have to use their MetaTrader platform.

Have a great trading week!

The Myfxbook team.

New Section – System Comparison, Oanda Accounts Update

New Features

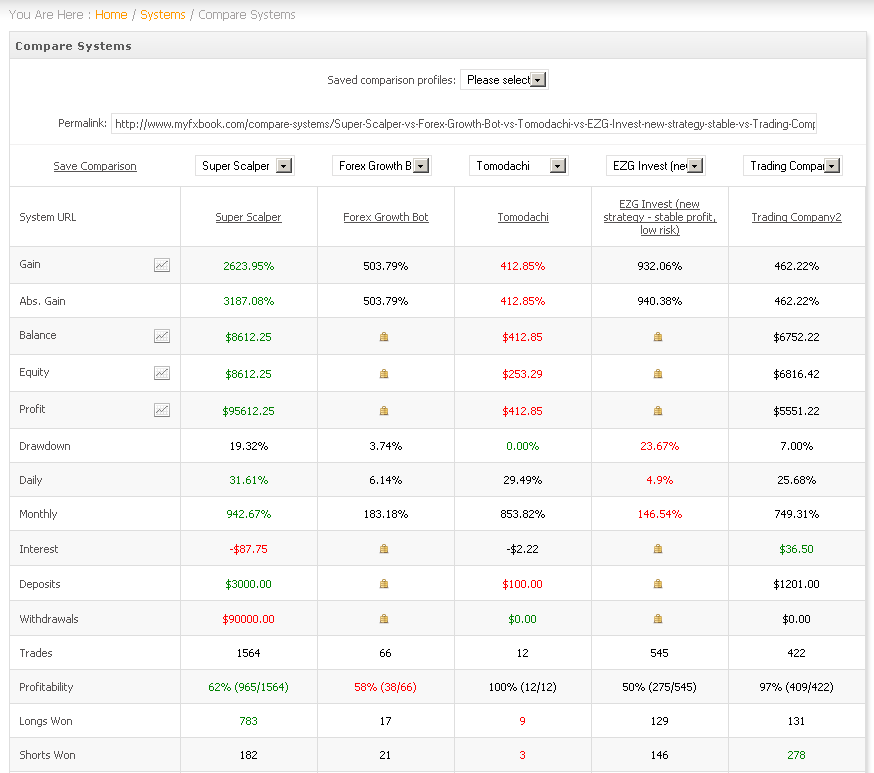
There are thousands of systems connected to Myfxbook, and you’ve probably browsed to several of them to check out the numbers and compare it either to your performance or someone else’s. Up until now there wasn’t an option to compare systems back-to-back, in order to quickly evaluate/compare the systems in question. Well,  no you can with the systems comparison page!

There are several key features to this new section:

  • Compare up to 5 systems simultaneously.
  • Quickly identify the best/worst values for each metric using the in-built coloring (green for best and red for worst).
  • Create and save an unlimited number of your comparison profiles for quick future reference.
  • Use a permalink to share the comparison of your selected systems with others.
  • Compare main metrics in one chart (gain, profit, equity and balance).

*The accounts for comparison are based on your watchlist and your private accounts in your portfolio.

Oanda Accounts Update

As some of you might have heard, Oanda are going to release the MetaTrader platform as one of their available platforms for trading – traders who will use the Oanda MetaTrader platform will be able to keep using Myfxbook as usual, so that’s great news! 🙂

If you have any comments or suggestions about the new section, do let us know!

We’re working on more new and exciting sections, so stay tuned! 🙂

Regards,

The Myfxbook team.

Oanda Accounts Will No Longer Be Supported

Guys, we’ve been waiting patiently for about a year now to receive an API from Oanda which will allow us to solve the expiring connection issue and remove any existing errors. Unfortunately, we haven’t received it and we’ve also been notified by Oanda that the current method we use to connect to Oanda accounts will stop working on January 31st (due to changes on their side).

We apologize for any inconvenience this is causing you, but there’s nothing we can do at this point. Myfxbook will no longer support Oanda accounts starting from January 31st.

There is no time frame on when they will complete the API, so any questions regarding this topic, please ask Oanda directly.

Thank you,

The Myfxbook team.

Update – Oanda will be supported through their MetaTrader platform.

4 New Metrics And 5 New Widgets!

Although it’s the holidays, we’re working hard (as usual! :)) on adding new features, implementing your suggestions, and fine tuning our systems! So what have we added today?

Sharpe Ratio – The Sharpe ratio is used to characterize how well the return of an asset compensates the investor for the risk taken. The higher the value, the better.

AHPR – Arithmetic Average Holding Period, or AHPR, is the average holding period return.

GHPR – Geometric Average Holding Period, or GHPR, is the geometric holding period return. A system having the largest GHPR will make the highest profits if compounded. A GHPR<1 means that the system will lose money if compounded.

Avg. Trade Time – average trade time.

The new statistics can be found in the advanced statistics window:

Since we keep adding more and more metrics, we’ve felt it was necessary to redesign a bit the advanced statistics for easier reading and interpretation, so no need to panic if the old metrics are not in its usual location :).

The new statistics will become available after the next account update.

We’ve also added 5 new widgets as you’ve requested (can be found in the custom widget):

Directional analysis:
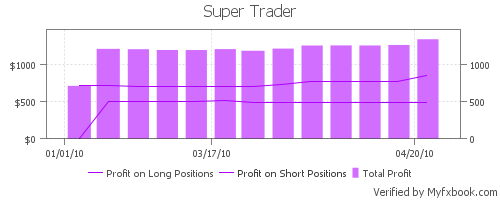
Profit chart:

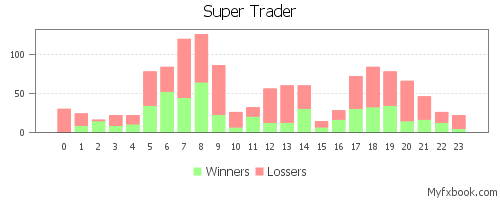
Hourly chart with 4 comparison modes (longs vs shorts, winners vs losers, longs profit vs shorts profit and winners profit vs losers profit:
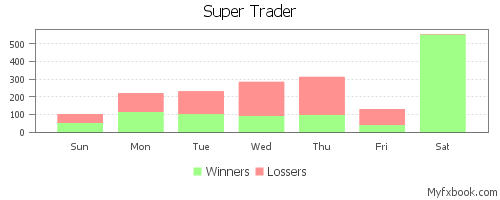
Daily chart with 4 comparison modes (longs vs shorts, winners vs losers, longs profit vs shorts profit and winners profit vs losers profit:
Monthly:


Keep in mind the widgets are self updating, so it’s a great way to promote yourself and have your performance always up to date, displayed in your or other’s website, blog or forum.

Happy holidays! 🙂

The Myfxbook team.
Risk of Ruin

We’ve just added another metric to the statistics which will help you to evaluate the risk of your/other’s trading system:

The Risk of Ruin table (under ‘Advanced Statistics’) will show you the probability of losing a certain %  of the account (ranging from 100% down 10%). It will also tell how how many consecutive losing trades are needed to reach the selected loss.

For easier interpretation of the table, you can simply hover over the selected column and a short sentence will appear explaining the numbers.

P.S. If you can’t see the new metrics, please clear your browser’s cache.

Happy Holidays,

The Myfxbook team.

1 New Feature, Contest Winners Announced.

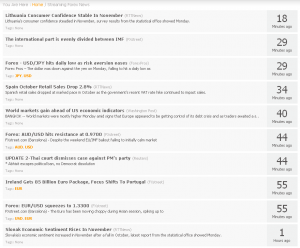
Today we’ve added a new streaming news page – this page aggregates top forex headlines from the leading news portals and streams it directly to you for quick view and immediate access (access it from the ‘home’ menu or from the ‘view all’ link in the dashboard news):

You can scroll down to reveal less recent news.

The news can be filtered by symbol tags such as EUR, USD, GBP etc. Use it to show news relevant to your trading only.

This is an initial version of the news page, and if you have any suggestion and/or comments, please feel free to share it with us.

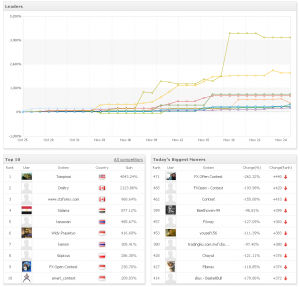
As to the contest – it has ended 4 days ago and here are the results:

Congratulations to the top 3 traders who won the contest:

1st place ($2,000), a return of 4043.24%Tompinaikd

2nd place ($1,000), a return of 2123.88%Dmitry

3rd place ($500), a return of 968.64%ctsforex

Winners, you will be contacted by fxopen to claim your prizes.

We’re about to open the registration for our next trading championship – stay tuned!

Regards,

The Myfxbook team.

1st place –

New Statistics

3 new statistics are added today (find it in the ‘advanced statistics’ window):

Expectancy – Expectancy tells you what you can expect to make (win or lose) on every trade.

Standard Deviation – Standard Deviation is a statistical measure of volatility. It shows how much variation or dispersion there is from the mean (Expectancy).

Z-Score – Z-Score is used for calculating the ability of a trading system to generate wins and losses in streaks. It enables us to see if the streaks generated are of a random pattern or not.

The above statistics can be analyzed in real time, if choosing to analyze a custom period.

* The new statistics will become available as soon as you update your account.

More statistics are on their way 🙂

Have a great trading week!

The Myfxbook team.