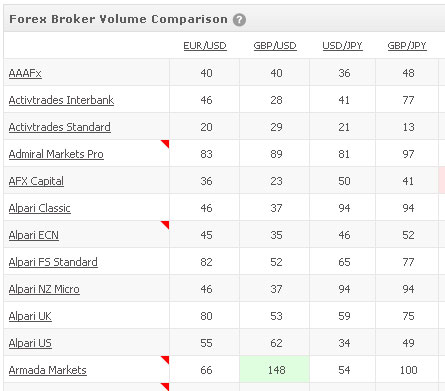
We’re excited to release another unique Myfxbook section – Forex Volume:

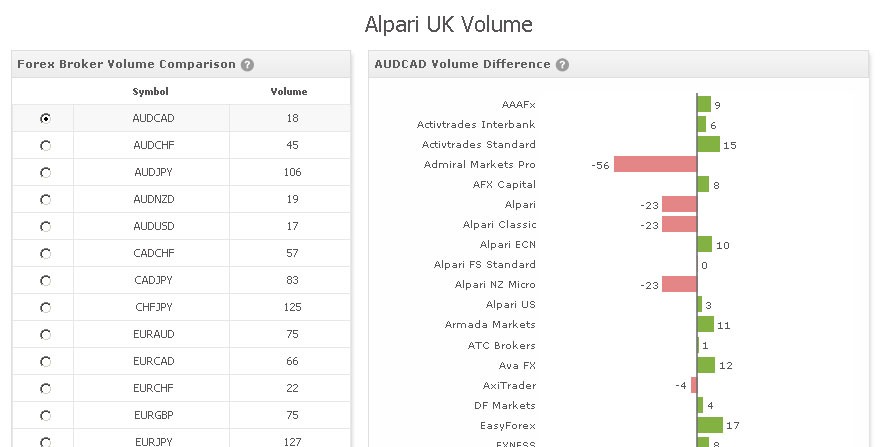
Clicking on a broker, will reveal a real-time volume comparison chart:
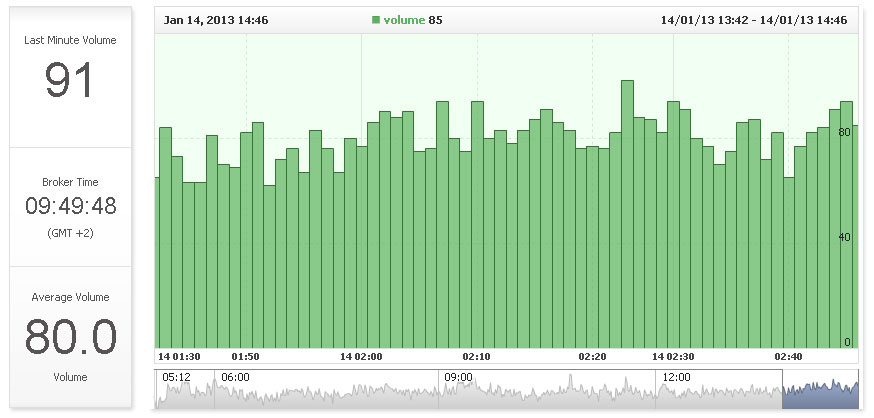
Clicking on a specific volume value will lead you to a real-time volume chart of that specific currency and broker in question for the last 48 hours.
Just as with the spreads section, you’ll see volume session averages below the chart, brokers with higher volume, a volume chart with economic events, ability to save the volume chart and also analyze volumes in real-time for different time-frames by zooming in and out of the chart.

Up until now it was impossible to know and compare volumes of different brokers. Why would one want to do that you may ask? The answer is that higher volume means higher liquidity which translates to lower (or better) spreads.
Now you can view and compare forex broker volumes in real time for over 80 different brokers! You can see which brokers have the lowest volumes and which ones have the highest volumes for over 100 different currencies.
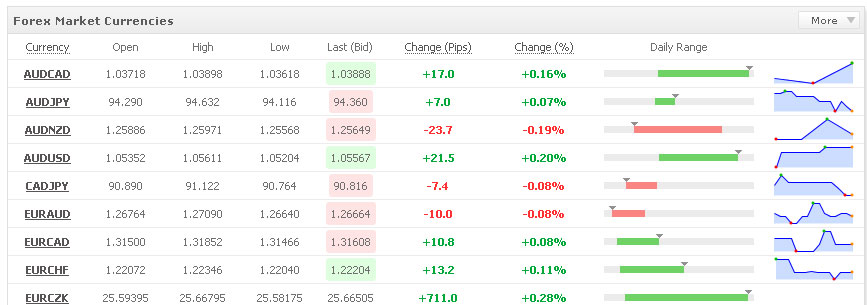
Another cool feature we’ve added is tick charts in the market section, on the right:

Like the new features? Want us to add another section? Let us know by commenting below or sending us a message.
Have a great week,
The Myfxbook team.

You’re reading the tick volume, not real volume. Tick volume != liquidity, it’s just an update frequency within a time period. It will move on brokers with no actual trades going through if their LP’s modify their bid/ask quotes.
This is a good new feature for comparing feed quality, but the way you’ve presented it is very misleading.
:/
Since forex markets are decentralized markets, there is obviously no official volume figures, however that is how Metaquotes represent volume in their MetaTrader platforms, which is exactly what we’re showing.
Yes, and the way Metaquotes presents it is ABSOLUTELY misleading. Amount of ticks sent per minute (price changes per minute) has nothing to do with the liquidity behind it. You should make that clear to the users of this tool since most of them are inexperienced and don´t know that amount of ticks doesn´t guarantee anything for real liquidity behind it.
You should rather call this: “Average Price Changes per Minute”, not “Volume”.
Wow.. I mentioned tick volume and defined it a bit for people who might not be aware. The point was your blog article suggested it was just ‘volume’ (along with the broker volume page having it written all over), and atop of that you go on to say:
“””Why would one want to do that you may ask? The answer is that higher volume means higher liquidity which translates to lower (or better) spreads.”””
Which is the misleading part. Since you didn’t point out you were measuring tick volume, and then tried to say that the higher tick rate would == more liquidity (and tighter spreads) as if it was real volume being measured. Tick volume is not related to these things.
Worse yet, instead of trying to see where my comment was coming from, you admitted to knowing what tick volume was and even demonstrated knowledge of it’s limits.. so basically, you knew better all along but still presented this feature as something it’s not and can never be.
I love MyFXBook’s services, you guys rock in general, but this kinda framing on a feature is just sad.
Jack, that is not misleading – as mentioned earlier, we simply use the volume definition as defined by MetaQuotes – their platform is used by hundreds of different brokers for several years now and that is probably the second best method of measuring forex volume (next to having actual volume data).
Moreover, it will be very confusing to label it under a different name when traders are already accustomed to seeing it as volume in their trading platforms.
Your feedback is much appreciated! 🙂
Thanks for the fantastic addition. this is a valuable indicator; especially to determine the effectiveness of EA when executing trade. I executed trade at a particular minute of the hour, so this tool very helped me pinpointing right broker.