Forecast

As a pioneer in forex portfolio tracking, we are always looking to invent the next game changing feature for you to enjoy and after much thought and development, we’re thrilled to announce a one of a kind, Portfolio Forecast  based on your actual trading! 🚀  Whether you’re a seasoned trader or just dipping your toes into the financial waters, this new feature will empower you to make informed decisions about your trading.

Let’s dive right in:

Non-Compounding Method:
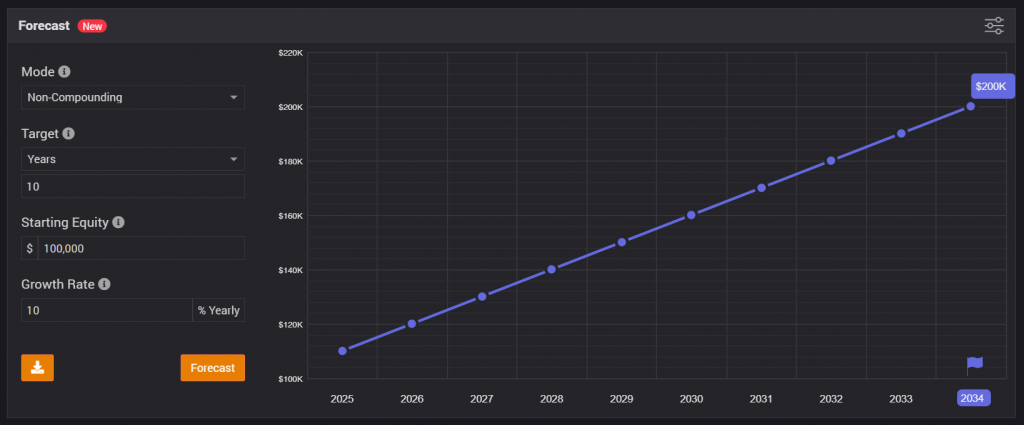
What it does: The non-compounding method provides a straightforward projection of your portfolio’s growth. It assumes that any gains (or losses) you make each year are not reinvested but instead remain static.

When to use it: If you prefer a conservative estimate or want to see a baseline scenario without the effects of reinvestment, this method is for you.

Compounding Method:
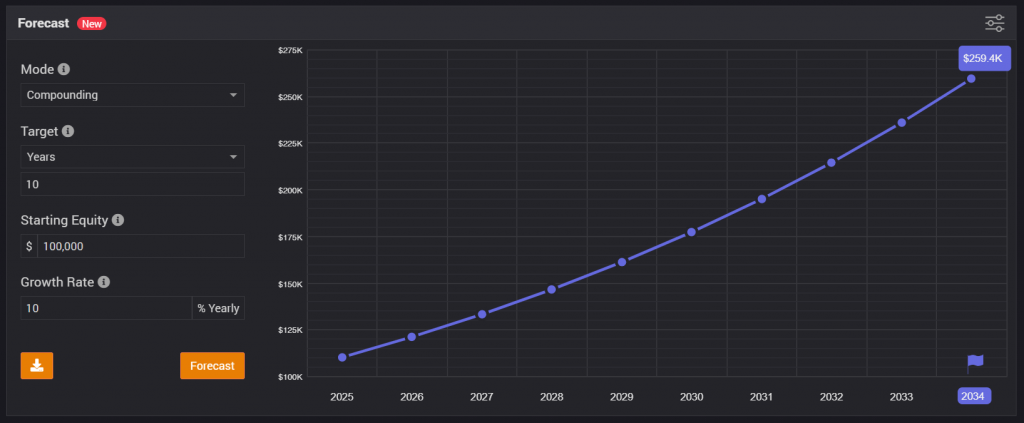
What it does: Compounding is the magic ingredient in long-term wealth building. This method factors in reinvestment of gains. As your portfolio grows, it compounds – earning returns on previous returns.

When to use it: If you’re in it for the long haul and want to see the compounding effect over time, this method is your go-to.

Monte Carlo Method:
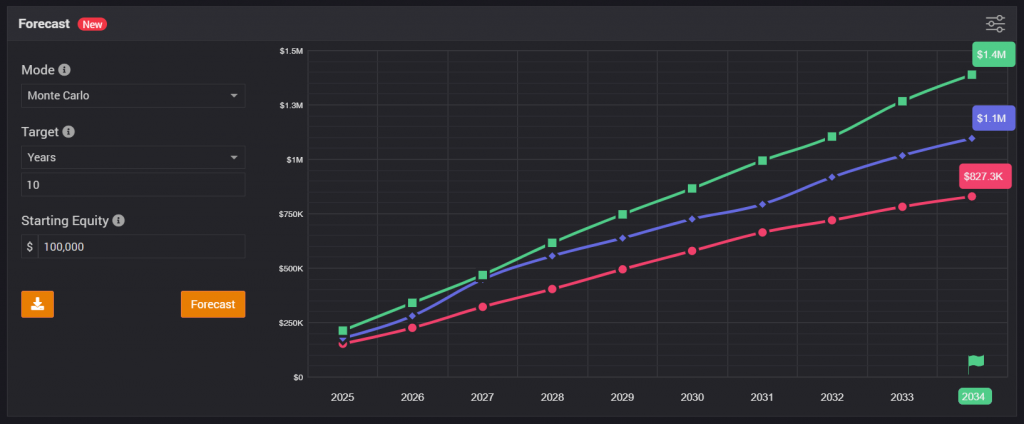
What it does: Buckle up! The Monte Carlo simulation takes portfolio forecasting to a whole new level. It considers randomness, market volatility, and countless scenarios. By running thousands of simulations, it gives you a distribution of potential outcomes.

When to use it: When you crave a realistic view of uncertainty—because life isn’t a straight line. Worried about market crashes? Curious about best-case and worst-case scenarios? Monte Carlo’s got your back.


What are the different settings?

Forecast Settings

The different modes allow you to target number of years, equity, profit or growth values. You can also set a custom growth value and/or starting equity to test different scenarios.

Chart Settings

Use the options of the chart (right top corner) to view the chart in different modes. You can choose to view it in a cumulative or yearly options; you can view plot as equity, profit, or growth.

Share it

Once the forecast is generated, whether you want to keep it for reference purposes or share it with your fellow traders or anyone else, just hit the download icon to save the forecast as an image.
Margin

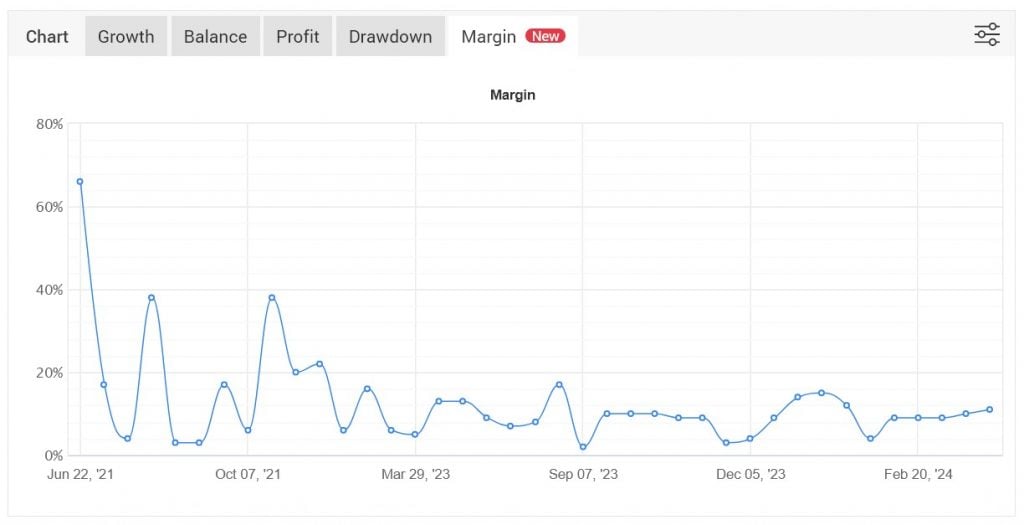
We’re happy to announce a new powerful metric addition to the statistics – margin. Margin is the amount of money you use to trade and it can tell a lot about a trading strategy. We’ve added this metric to further support your trading decisions or help analyse someone else’s trading strategy.


The new margin chart is visible at the top of a system page:

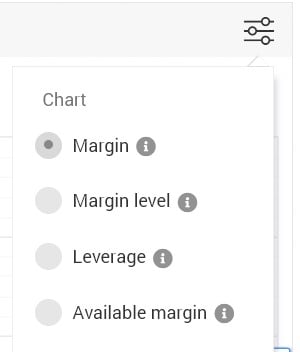
It includes 4 different chart types:


Margin – Margin is the percentage (%) value based on the amount of equity versus position value.
Margin Level – Margin Level is the percentage (%) value based on the amount of equity versus required margin.
Leverage – Actual leverage used by the account based on position nominal value versus account equity.
Available Margin – Available free margin represented as percentage (%) of total account margin.

The margin metric will help you understand if a trading system is taking excessive risks, how close was (or is) it to a margin call, and the real leverage used throughout the lifetime of the trading account.


Wishing you profitable trading, 

The Myfxbook Team.

Lot Size Calculator

Before opening a position in your Forex Trading account, calculating the correct lot size or position size may not be a simple task, especially when you’re in a hurry to open a position.

When calculating the position size, you need to take into account multiple factors:

  • trade sizing with your broker which may be a standard lots (100,000 units), mini lots (10,000 units) or micro lots (1,000 units). The trade size will affect the pip value, for example:
lot.size.example
  • the risk percentage (or alternatively the dollar amount) you can afford to lose in case the trade goes against you and hits your stop loss
  • the stop loss according to your risk appetite

Using the above inputs along with your account balance and deposit currency can be easily calculated for the different account currencies.

Most importantly, this calculation changes for each currency pair you trade and therefore it is best to use our forex position size calculator and risk calculator. lot size calculator

Keep in mind that risk is one of the most important factors – Forex is high risk and therefore you shouldn’t risk more than 5% per trade. Remember that at 10% risk per trade it takes only 10 losing trades to wipe out your account! If you’re not sure how many pips you should set for the stop-loss, head over to our pip calculator.

Our calculator covers many foreign exchange pairs:

Majors

EURUSD

USDJPY

GBPUSD

USDCHF

USDCAD

AUDUSD

NZDUSD

Minors

EURGBP

EURJPY

GBPJPY

GBPCAD

CHFJPY

EURAUD

NZDJPY

AUDCAD

AUDJPY

AUDCHF

AUDNZD

AUDSGD

CADCHF

CADJPY

CHFSGD

EURCAD

EURCHF

EURHUF

EURPLN

EURNZD

GBPAUD

GBPCHF

GBPNZD

NZDCAD

NZDCHF

Exotics

EURTRY

EURCZK

EURMXN

EURNOK

EURSEK

EURSGD

EURZAR

GBPMXN

GBPSEK

GBPSGD

GBPTRY

NOKJPY

NOKSEK

SEKJPY

USDRUB

GBPNOK

SGDJPY

USDCNH

USDCZK

USDHUF

USDMXN

USDPLN

USDSEK

USDNOK

USDSGD

USDTHB

USDTRY

USDZAR

CFD

XAGAUD

XAGEUR

XAGUSD

XAUAUD

XAUCHF

XAUEUR

XAUGBP

XAUJPY

XAUUSD

XBRUSD

XNGUSD

XPDUSD

XPTUSD

XTIUSD

Economic Calendar – a must have for traders

You can trade the markets with a fundamental, technical or mixed approach. In all cases, you must be aware of any upcoming economic events which may move the markets in your favor or against you. Knowing of the next event and its anticipated impact might produce a new trading opportunity or allow you to close your existing position before the market turns.

Using Myfxbook’s economic calendar gives you access to economic releases in real time, as they happen along with immediate interpretation of the figure, ie if the result was better than expected or worse than expected.

Our economic calendar covers events from around the worlds, no matter if their impact is low or high.

For example, for USA (largest economy with most impact)

  • Non Farm Payrolls
  • FOMC Minutes
  • FED Interest rate decisions
  • initial Jobless Claims

For UK:

  • BoE intererst rate decisions
  • Markit Services PMI
  • Gross Domesic Product (or GDP in short)

For Eurozone:

  • Retails Sales
  • Consumer Price index (or CPI in short)
  • ECB Interest rate decisions

Our economic calendar makes it very simple for you to read it;

You can filter events by:

  • a time-frame (today, tomorrow, this and next week or custom)
  • by an events impact (high, medium, low or none at all)
  • by symbol (roughly 40 different symbols covering 1000 indicators)
Economic calendar settings

Moreover, the calendar shows a countdown for the next event (matched to your local timezone) so you don’t need to do any number crunching to convert the time to your local time). Also flag of the relevant country is shown next to each event.

Clicking on an event will reveal abundance of data:

  • the explanation on the event and its source.
  • the historical values of past releases of the specific economic event.

The events are updated real-time and will show a popup once released if you’re browsing our website in a different section.

Economic calendar notification

Not only our calendar is best in class, but it is also mobile friendly, so you can get the same calendar through your mobile phone, on the go.

If you’re going to be away and want to be notified by email – no problem! Set up an automated notification to your email of upcoming economic events and releases.

Our economic calendar is used by millions of traders and if you’re not one of them, you can start here:

https://www.myfxbook.com/forex-economic-calendar

Forex Outlook Indicator

We are excited to announce the release of our outlook indicator. The indicator allows you to plot the outlook data in your MT4 trading account, streaming it live and adding additional features not available in the website:

  • Plot up to 10,000 data points per timeframe(website limited to 1000 points)
  • Additional timeframes – weekly and monthly.
  • Custom colours.
  • Custom display.
  • Additional data type (Percent).

The outlook data is calculated based on the hundreds of thousands of live Myfxbook accounts (no demo accounts).

Subscribe to a yearly plan and get 2 months free: https://www.myfxbook.com/outlook-indicator

Best Regards,
The Myfxbook Team.

FIXI Trading Cup July 2018 Contest Winners Announced

The recent trading contest sponsored by FIXI Markets has ended and top 10 traders to win the prizes are:

1st place – gladkiyya 1009%, winning $3000

2nd place – Rahim 1006%, winning $1300

3rd place – ajtkr_2 829%, winning $1000

4th place – karman 639%, winning $450

5th place – Nomi099 547%, winning $400

6th place – dawoodi 518%, winning $350

7th place – MS 424%, winning $300

8th place – awvwdeyu 397%, winning $250

9th place – Teedekd 392%, winning $200

10th place – jeevash 358%, winning $150

11th place – KashiNaath 291%, winning $100

forex contest

Trades profitability was very much similar between winning and losing accounts: 75%/59% of winning trades and 25%/41% of losing trades, respectively.

Average trade result in pips showed that winners had on average 2.57 times larger win than of a losing account as well as 5.42 times larger losses.

Have a great week,

The Myfxbook Team.

FIXI Markets BullsEye June 2018 Contest Winners Announced

The recent trading contest sponsored by FIXI Markets has ended and top 10 traders to win the prizes are:

1st place – Contest – presnysim 2158%, winning $3000

2nd place – Contest – Janju 2151%, winning $1500

3rd place – Contest – braggaok 1634%, winning $1000

4th place – Contest – stasiyan_trade 1039%, winning $600

5th place – Contest – Madushanka11 994%, winning $400

6th place – Contest – everytick 872%, winning $300

7th place – Contest – s1quash91 677%, winning $250

8th place – Contest – SilverForex 671%, winning $200

9th place – Contest – BullBeer 631%, winning $150

10th place – Contest – Sarahngari 589%, winning $100

Forex contest - fixi

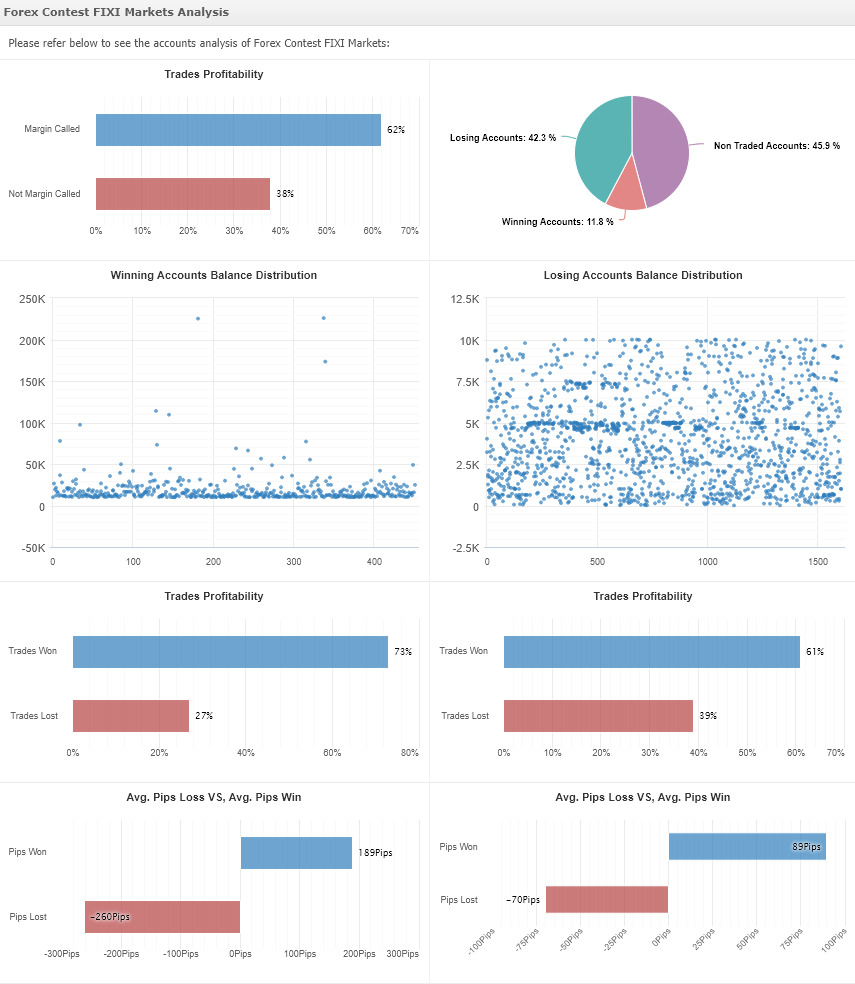
Trades profitability was very much similar between winning and losing accounts: 73%/61% of winning trades and 27%/39% of losing trades, respectively.

Average trade result in pips showed that winners had on average 2.1 times larger win than of a losing account as well as 3.7 times larger losses.

Have a great week,

The Myfxbook Team.


New Trading Contest, FIXI TRADING CUP – $7500 In Prizes

Today starts the next trading contest for 2018, with prizes in total of $7500, sponsored by FIXI Markets:

fixi

You can register freely and compete with a demo account against other traders for real prizes:

1st place: $3000

2nd place: $1300

3rd place: $1000

4th place: $450

5th place: $400

6th place: $350

7th place: $300

8th place: $250

9th place: $200

10th place: $150

11th place: $100

Trading will commence on July 1st and will end after a month of trading, after which the winners will be announced.

For more details and signup:

https://www.myfxbook.com/contests/forex-contest-fixi-trading-cup/44/rules

Have a Great Week!

The Myfxbook Team.

New Trading Contest, $7500 In Prizes

Today starts the next trading contest for 2018, with prizes in total of $7500, sponsored by FIXI Markets:

fixi

You can register freely and compete with a demo account against other traders for real prizes:

1st place: $3000

2nd place: $1500

3rd place: $1000

4th place: $600

5th place: $400

6th place: $300

7th place: $250

8th place: $200

9th place: $150

10th place: $100

Trading will commence on June 3rd and will end after a month of trading, after which the winners will be announced.

For more details and signup:

https://www.myfxbook.com/contests/forex-contest-fixi-markets/43/rules

Have a Great Week!

The Myfxbook Team.


Arum Capital Contest Winners Announced

The recent trading contest sponsored by Arum Capital has ended and top 17 traders to win the prizes are:

1st place – Contest – pakemon18 3.3M%, winning $1200

2nd place – Contest – malchish 110133.0%, winning $600

3rd place – Contest-protrader0505 53853.0%, winning $300

4th place – Contest-realarbitrage 26787.0%, winning $300

5th place – Contest – mkcell 15409.0%, winning $200

6th place – Contest – emofx 13357.0%, winning $200

7th place – Contest – shawnlee 8800.0%, winning $200

8th place – Contest – SD_trader 4550.0%, winning $100

9th place – Contest – Rohitfx 3596.0%, winning $100

10th place – Contest-buhtoyarrky 1760.0%, winning $100

11th place –  Contest – Nicholus 1306.0%, winning $100

12th place –  Contest – eaboss 1103.0%, winning $100

13th place –  Contest – Tomny 944.0%, winning $100

14th place –  Contest-priyadarshana 814.0%, winning $100

15th place –  Contest – AmlehK 799.0%, winning $100

16th place –  Contest-lucacortex 694.0%, winning $100

17th place –  Contest – Bakheet 683.0%, winning $100


Forex Contest

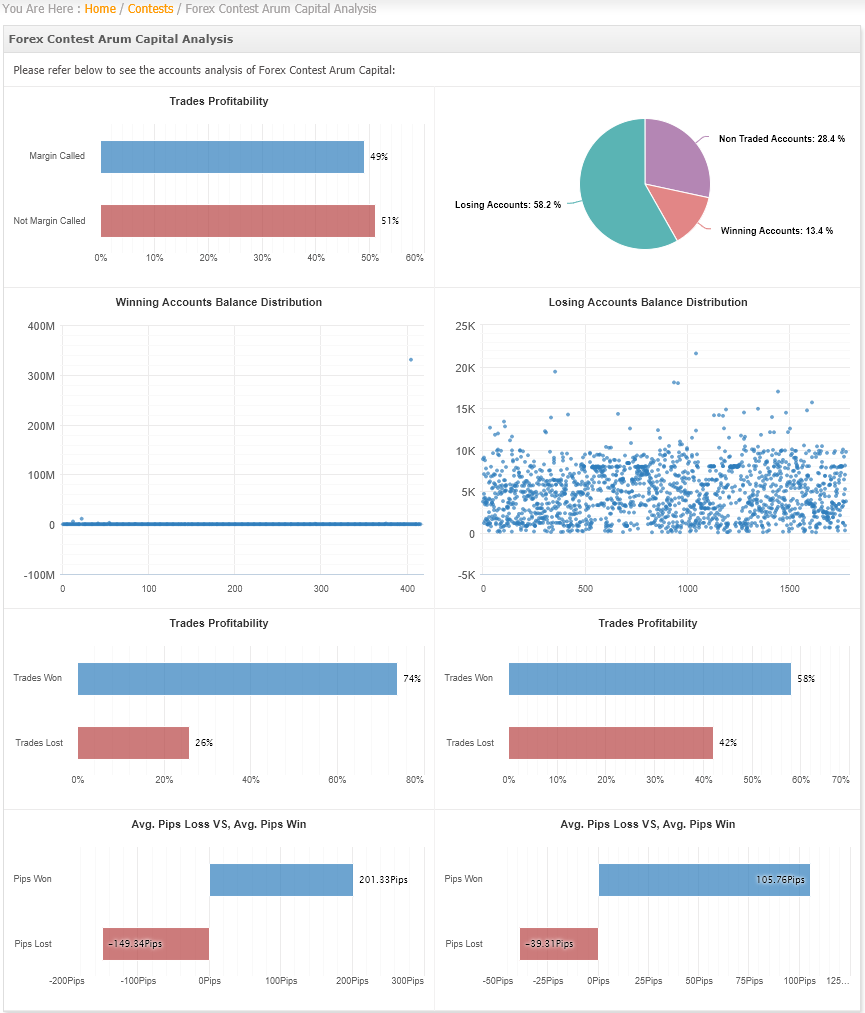
As seen in the analysis of the contests, a high percentage of participants traded their accounts (71.6%) out of which, 13.4% were profitable.

Trades profitability was very much similar between winning and losing accounts: 74%/58% of winning trades and 26%/42% of losing trades, respectively.

Average trade result in pips showed that winners had on average 1.9 times larger win than of a losing account as well as 3.8 times larger losses.

We would like to remind the winners that in order to claim the prize you must register and complete the verification with Arum Capital.

Please note In case discrepancies are found in the data initially provided by the winner and the supplied documents, the winner shall be disqualified. In case the winner is unable to open a live account within 20 business days with the broker, he/she will be disqualified.

*Withdrawal is only available via Skrill and Netteller payment systems.

Have a great week,

The Myfxbook Team.