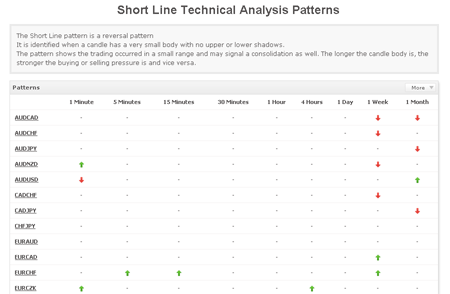
We’re excited to announce another super advanced section (which is yet again another powerful tool for any trader, unique to Myfxbook!) – Patterns:
Any technical trader knows that searching for a pattern in a chart is a very tedious task and time consuming task – well no more! The new section allows you to view in real time, 60 different trading patterns for over 60 different symbols in 9 different time-frames in a single glance! Our systems will constantly scan the prices for patterns in real-time and will show you (in real time) of any such pattern forming. Not only the pattern is identified, but it is immediately seen if it is a bullish pattern or a bearish one. For your convenience, each pattern has a complete definition.
Important to note that some patterns are neutral ones and so you’ll have to determine the bias (bullish or bearish) on your own. A bullish pattern will be marked with an up arrow (![]() ), a bearish one with a down arrow (
), a bearish one with a down arrow (![]() ) and a neutral one with a orange circle (
) and a neutral one with a orange circle (![]() ).
).
You can either check the Pattern section to view selected symbols and patterns, click on a specific symbol to view its selected patterns or click on a pattern to view where the pattern occurs with selected symbols only.
The pattern section covers the following patterns:
Abandoned Baby
Advance Block
Belt-hold
Breakaway
Closing Marubozu
Concealing Baby Swallow
Counterattack
Dark Cloud Cover
Doji
Doji Star
Dragonfly Doji
Engulfing Pattern
Evening Doji Star
Evening Star
Gravestone Doji
Hammer
Hanging Man
Harami
Harami Cross
High-Wave
Hikkake
Homing Pigeon
Identical Three Crows
In-Neck
Inverted Hammer
Kicking
Ladder Bottom
Long Legged Doji
Long Line
Marubozu
Mat Hold
Matching Low
Modified Hikkake
Morning Doji Star
Morning Star
On-Neck
Piercing
Rickshaw Man
Rising-Falling Three Methods
Separating Lines
Shooting Star
Short Line
Side-by-Side White Lines
Spinning Top
Stalled Pattern
Stick Sandwich
Takuri
Tasuki Gap
Three Advancing White Soldiers
Three Black Crows
Three Inside Up-Down
Three Outside Up-Down
Three Stars In The South
Three-Line Strike
Thrusting
Tristar
Two Crows
Unique 3 River
Upside Gap Two Crows
Upside-Downside Gap Three Methods
As always, we’re glad to hear of any comments and suggestions you may have :).
Have a great week ahead!
The Myfxbook Team.

Looks very interesting
Thanks
Many thanks for adding the new feature.. now to test 🙂
I’m Lovin’ It…:)
Love the idea, but it’s a bit unworkable at the moment, instead of only filtering the patterns, could we also filter the timeframes? While we’re at it, could the patterns for which there is not a single match in any of the timeframes be excluded from the list? Thanks!
Yes for both suggestions! Forwarded to the dev team!
Thanks! 🙂
A very welcome idea! Candlestick patterns is a great tool!
a very welcome idea
Great tool guys!
I have a question… What time is the broker/chart server you are using to plot these signal patterns?
I always want to trade off a chart that uses the 5 PM NY Eastern Time Day close /New Day candle as most major players use.
The reason I ask is it makes a big difference in the candle patterns.
Time of day (like which trading session, or hour) the patterns show up in would be a great filter.
Then toss in some stats on each pattern’s follow through per pair, per time segment, per chart period, etc..
It would be great if we can select to display all pairs instead of limiting to 10
any link to a chart which shows the particular pattern would be nice.
very helpful for me
thanks 🙂
Nice!!
What is the gmt?
Anyway to add in email alerts?
Like I’m in Singapore so my broker is +0800. The 4hr is different from some brokers.
We use GMT +0 timezone, the feed is an aggregation of multiple high quality feeds.
GMT +0.
Email alerts are coming up next 🙂
How many pairs are you trading simultaneously? 10 pairs should be more than enough for an average trader 🙂
thanks myfxbook very good
Thanks for this great feature.
Is it possible to publish the patterns in a PDF for users so that we’ll become familiar with them asI don’t know some of the formation at all.
Thanks in advance
Thanks myfxbook! Very interesing 🙂
Are you referring to the definition of each pattern?
I’d like to use it as a dashboard to scan for possible setups more than monitoring the opened trades… so it’s better to display as many pairs as possible.
I suggest for neutral bias, a yellow dot replaces the green tick.
Exactly, Tom.
Myfxbook, please consider the option to display more pairs. Cheers!
Sounds like a good idea! Forwarded to the dev team.
Thanks!