Analyzing your account as a whole might not always be enough – pinpointing the exact issues might be a very difficult task but using Myfxbook definitely helps :).
Although we’re proud to have the best and most useful tools for this task, we’re always looking for new ones and as a pioneer in forex trading analysis, we design and create unique tools giving you an edge unavailable anywhere else. We’re excited to reveal the result of our hard work which is one of the most powerful additions to your tool-box: Trade Analytics.
The trade analytic will show in your history tab, in your private portfolio and in your public system page (with appropriate privacy settings):

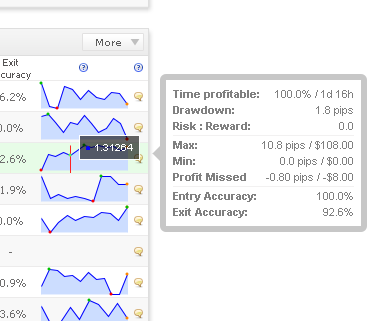
The trade analytics will tell you everything you ever wanted to know about each of your trades with the next 8 statistics:
Time Profitable – how long was the trade profitable in percent and in absolute time.
Drawdown – worst drawdown experienced during the trade’s lifetime, in pips.
Max – the max profit of the trade experienced, in pips and money.
Min – the min profit (highest loss) of the trade experienced, in pips and money.
Risk : Reward: the risk:reward ratio of the trade (based on the max and min values of the trade!).
Profit Missed – how much profit did you miss by not exiting on time (profit which was already yours).
Entry Accuracy – how accurate was your entry.
Exit Accuracy – how accurate was your exit.
Efficiency figures identify how much of a trading range your forex trading system captures. The trading’s range timeframe is defined by your trade’s entry and exit points and the price range is defined by the trade’s high and low values.
You can sort your trades based on these new metrics by clicking the ‘more’ button in the history section and adding the new metrics.
Please note the above statistics are supported for over 50 different forex pairs and will be available only for verified accounts and for recent trades (which is another great reason to connect your forex trading account to Myfxbook as soon as you open it! :)).
Another feature added is menu customization:
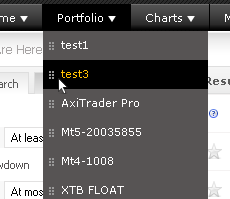
You might have noticed a small handle next to each account/portfolio in the Portfolio menu – you can now move around the items to reorder them as you wish and it will be instanly saved (remember you can create and manage your portfolio groups through your settings area, ‘Manage Portfolios’ button).

One last addition: Forex Broker Volume Widget:
Just as in the website, the widget is self updating the data.
Get the code on https://www.myfxbook.com/forex-broker-volume (green ‘add to site’ button) and place it in your blog/website).
Do let us know what you think and if you have any suggestions/comments.
Have a great week!
The Myfxbook Team.
Awesome stuff! Can you please explain how Entry and Exit Accuracy is calculated?
Brilliant! Would be great if we could get these stats when we download the csv file!!
Keep up the awesome work.
I’d like to thank you for your brilliant work!
Also, I’d like use this opportunity to ask you whether it will be possible in future to link account with Dukascopy or import trades manually?
I have to hand it to you guys/girls.
You really have build such a priceless website. As much as traders might hate it, this website gives them the cold hard statistics in various means which will either help make you or break you.
All I will add is if you traders are using multiple trading systems on one account. Label them and use the data! Find out what is making you money and ditch what isnt. See if you can improve the one that is making you money!
This website helped me identify that… All the best.
Thanks Team
Thanks for implementing my request MyFxbook! 🙂
http://www.myfxbook.com/community/suggestion-box/max-floating-drawdown-per-trade/417589,2
Sure. Here you go:
Entry accuracy calculation
Buy trade: (Highest high – Entry price) / (Highest high – Lowest low)
Sell trade: (Entry price – Lowest low) / (Highest high – Lowest low)
Exit accuracy calculation
Buy trade: (Exit price – Lowest low) / (Highest high – Lowest low)
Short trade: (Highest high – Exit price) / (Highest high – Lowest low)
Added to the to-do list! 🙂
We do plan to make it possible in the future, although I do not have an ETA at this time.
You’re welcome! 🙂
Thank you for sharing your experience!
MyfxBook you guys are great!
All the tools you make and everything is very helpful really!
I have question, when calculating entry accuracy , for example highest high is in what time referance ? becase a highest high on a long enough time scale could not be the highest high. Is it highest high of the duration of the trade ?
I think there’s something wrong with the Drawdown formula. I’ve got trades that show a drawdown of 2-3 times my stoploss.
We can’t calculate a trade that took a year to complete with 1 minute data since such a calculation will take a lot of time to complete, however trade data is calculated with the best timeframe possible.
Drawdown by definition is highest peak to valley loss. Stop loss is relative to the entry, while a drawdown can be measured from the highest high of your trade.
Hi,
This is a great improvement !
But something may be improved.
I think Risk:Reward should be calculated based on the initial order values.
I like to move my SL to breakeven +1pip, if the trade closes at my TP I often have an insane R:R of 1:20 or more.
At least we should have the choice whether to take last modified order values or not.
Best regards !
Hi,
Will this great feature will be accessible for MT5 accounts in the future ?
Thank you.
Yes, definitely :).
You have some very smart and imaginative staff at MyFXBook.
These new features look great and will be a welcome addition. After all you cannot analyze too much!
Keep up the great work.