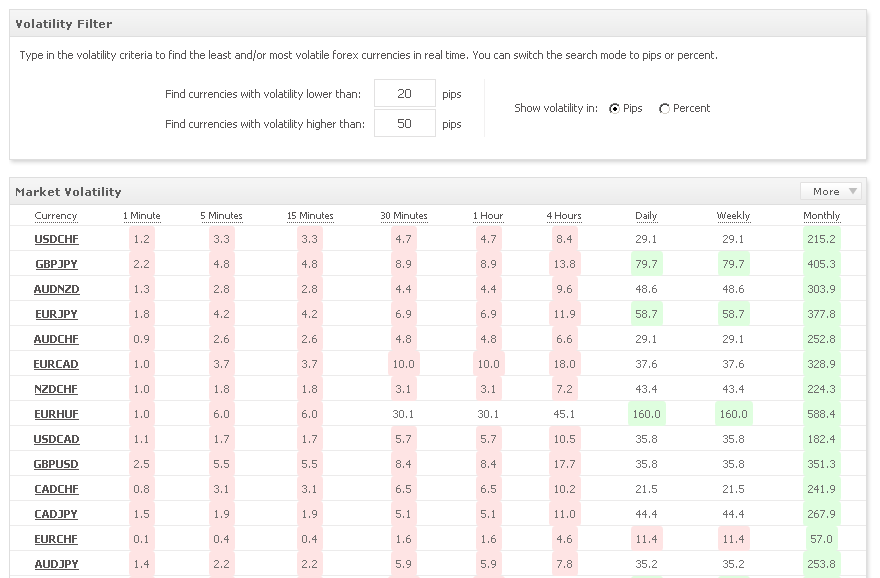
We’re excited to reveal the addition of another very useful section called Forex Volatility:
In this section, you can see in one glance the volatility of each available forex currency (over 50) in each of the available timeframes (9 to be exact). Moreover, you’re able to filter in real time the desired volatility, by a max/min value.
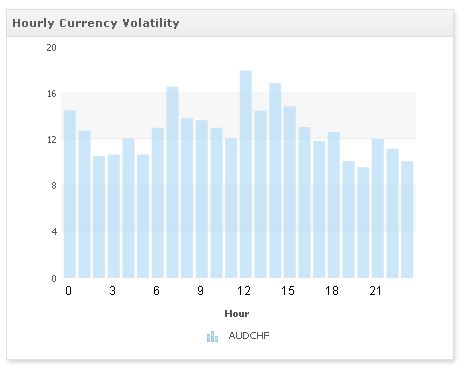
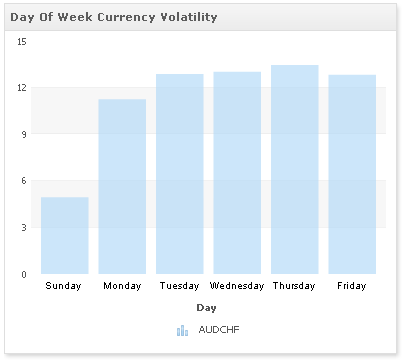
Clicking on a currency, will reveal its complete volatility analysis, either by hour of day, day of week, or day of month:
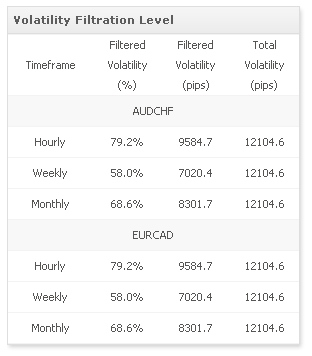
Moreover, you’re able to select/deselect any of the available search criteria and analyze the expected volatility (again) in real time! You’ll also notice the volatility filtration level based on your settings, so you know how much volatility are you catching (or missing):
Wish to compare another currency side by side? No problem! Just select the currency for comparison and continue analyzing the data in real time.
With the help of this new section, you can now answer many questions, such as:
– What is the most volatile and least volatile currency?
– Am I missing a lot of the market’s volatility when I trade?
– What hours should I avoid due to lower volatility?
– What currencies have a similar volatility?
As always, let us know of any feedback you may have and any additional sections (or tools) you’re missing.
Happy trading,
The Myfxbook team.


The sections being added to Myfxbook so regularly are fascinating. But they all could do with tutorials so that we can be sure we use them correctly. I’m sure the very advance traders love you for the plethora of sections. I for one would appreciate more explanation and information about how to use the tools.
How exactly are you measuring volatility?
You’re right. We’ll try to find the time to do that.
We made effort to design the new sections self explanatory, however if you have any doubts, please do not hesitate sending a message 🙂
The volatility table measures volatility takes the (high-low) values of the candle based on the timeframe in question;
When you analyze a specific currency, we use 1 hour bars and sum up the (high-low) values of each one up to 40 days back (approximately) – this gives a “high resolution” volatility measurement as a currency can move in a day 100 pips up and then 100 pips down, which will be seen as 100 pips on a daily scale but can be double or more based on an hourly scale for the day.
So the number for every timeframe represents a high-low average over the past 40 days – is that correct?
Looking at the Hourly Currency Volatility of a specific currency pair, is zero midnight based on the timezone set in my profile preferences?
I think the value of tutorials would not *just* be about offering a better understand of how a tool works, but giving examples of how clever people use these tools to learn more about the market.
Thank you for a brilliant platform!
Yes, the entire forex market section is adjusted to match your timezone set in the profile settings.
Thanks for the feedback 🙂