As a pioneer in forex portfolio tracking, we are always looking to invent the next game changing feature for you to enjoy and after much thought and development, we’re thrilled to announce a one of a kind, Portfolio Forecast based on your actual trading! 🚀 Whether you’re a seasoned trader or just dipping your toes into the financial waters, this new feature will empower you to make informed decisions about your trading.
Let’s dive right in:
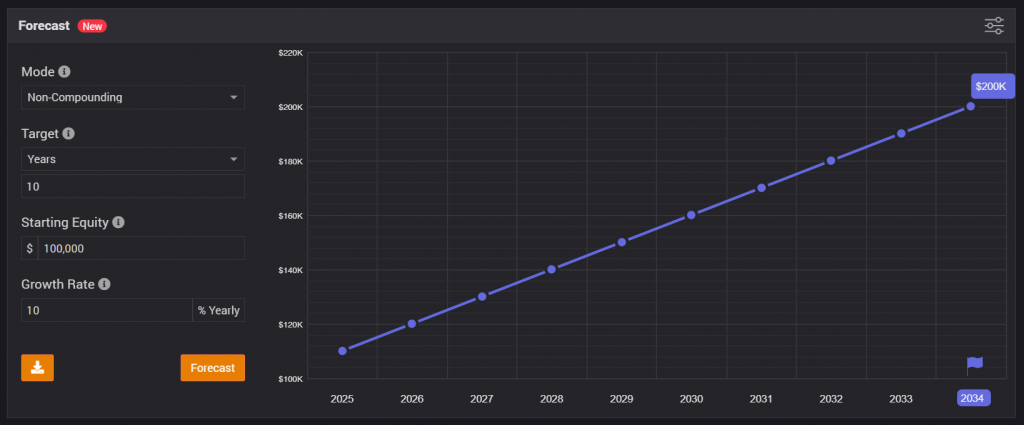
Non-Compounding Method:

What it does: The non-compounding method provides a straightforward projection of your portfolio’s growth. It assumes that any gains (or losses) you make each year are not reinvested but instead remain static.
When to use it: If you prefer a conservative estimate or want to see a baseline scenario without the effects of reinvestment, this method is for you.
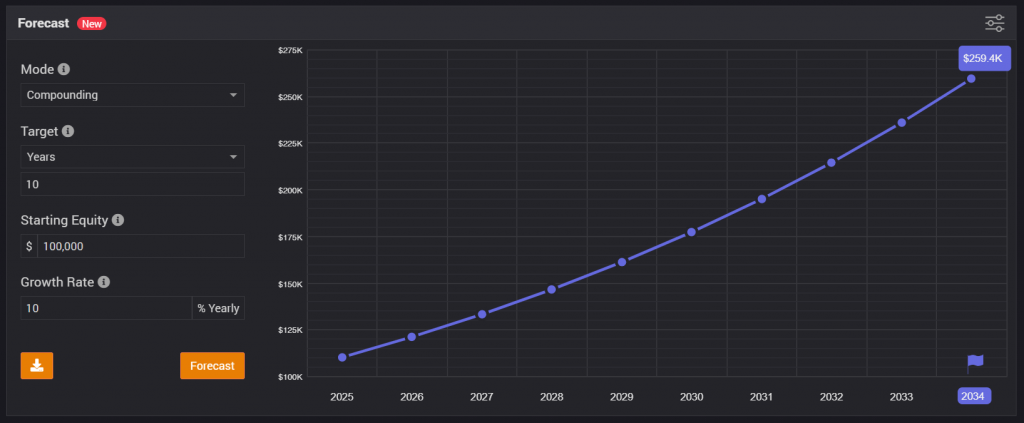
Compounding Method:

What it does: Compounding is the magic ingredient in long-term wealth building. This method factors in reinvestment of gains. As your portfolio grows, it compounds – earning returns on previous returns.
When to use it: If you’re in it for the long haul and want to see the compounding effect over time, this method is your go-to.
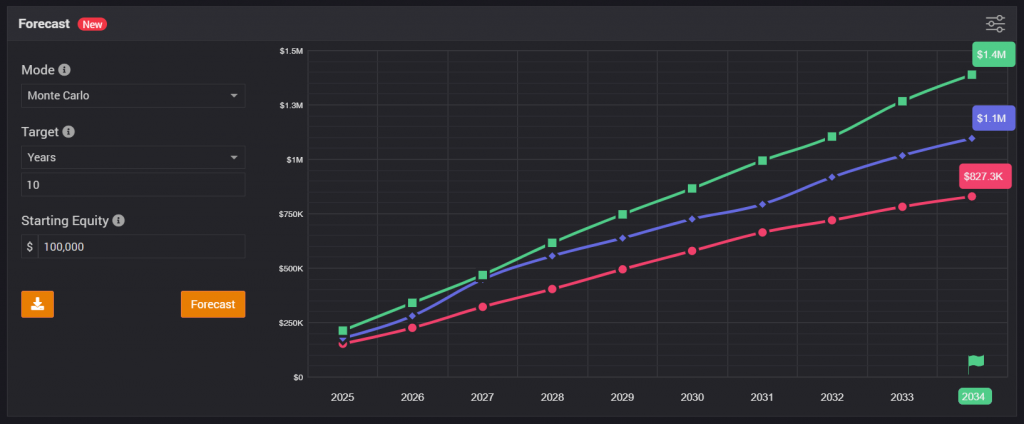
Monte Carlo Method:

What it does: Buckle up! The Monte Carlo simulation takes portfolio forecasting to a whole new level. It considers randomness, market volatility, and countless scenarios. By running thousands of simulations, it gives you a distribution of potential outcomes.
When to use it: When you crave a realistic view of uncertainty—because life isn’t a straight line. Worried about market crashes? Curious about best-case and worst-case scenarios? Monte Carlo’s got your back.
What are the different settings?
Forecast Settings
The different modes allow you to target number of years, equity, profit or growth values. You can also set a custom growth value and/or starting equity to test different scenarios.
Chart Settings
Use the options of the chart (right top corner) to view the chart in different modes. You can choose to view it in a cumulative or yearly options; you can view plot as equity, profit, or growth.
Share it
Once the forecast is generated, whether you want to keep it for reference purposes or share it with your fellow traders or anyone else, just hit the download icon to save the forecast as an image.